"Strategizing an AMD's Short-Sell with a Call Option Hedge"
- Publication Date: 02/13/2024
Executive Summary
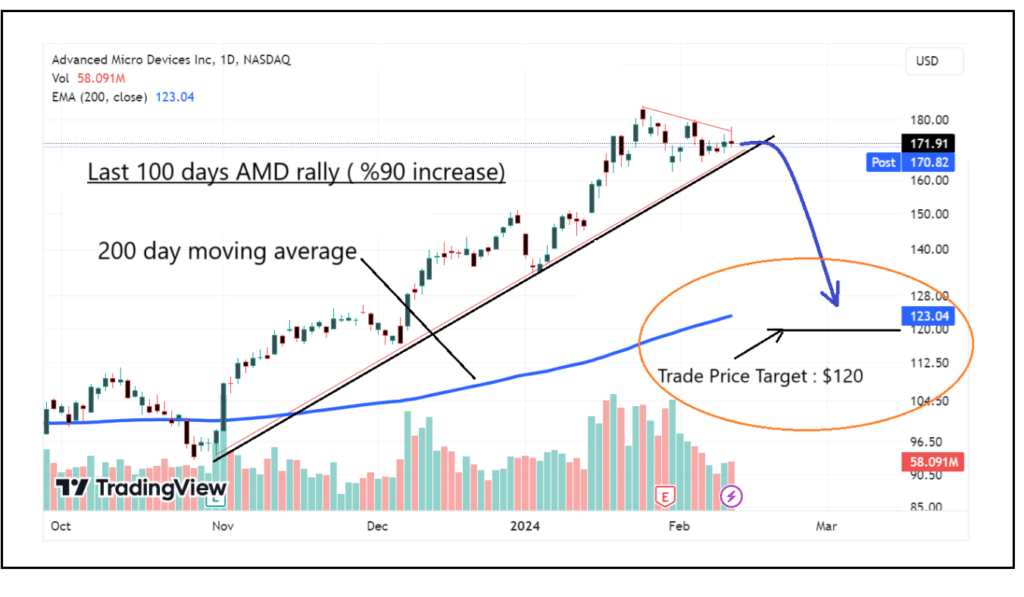
In the ever-evolving landscape of the stock market, certain tales of rapid ascension captivate and often caution investors. These dynamics create contrasting trading ideas. One such narrative that has unfolded with remarkable fervor is that of Advanced Micro Devices (AMD). Within just 80 trading days, AMD's stock has soared, charting an almost 90% increase in value adding almost $100 billion to its market cap—a testament to the company's robust position within the semiconductor and AI sectors. This remarkable growth not only underscores AMD's technological advancements and market demand but also mirrors a broader market trend where high performance has become a hallmark of the current financial epoch.
Yet, as seasoned strategists know, the zenith of success often precedes the necessity for recalibration. Amidst this backdrop of market exuberance, AMD's recent trajectory presents a nuanced picture. In the last three weeks following its earnings report, the stock has begun to show signs of underperformance relative to its preceding meteoric rise of 90% during the last 3-month rally and the broader market's ongoing robustness. This divergence signals a potential inflection point, offering a moment ripe for strategic consideration, especially with the major NYSE Composite reaching a critical resistance level in February 2024.
- Executive Summary
- Trade Analysis Report: AMD Hedge Shorting Strategy
- Navigating the Heights – A Tactical Shift in Strategy
- AMD's Performance: A Deep Dive into the Rally and Relative Dynamics
- AMD's Recent Earnings
- A Detailed Examination of Market Dynamics: Unveiling an Important Technical Resistance
- Bubble like sentiment on AI stocks
- SEC comments about AI washing
- Strategizing AMD's Short-Sell: Analyzing Risks and Rewards with a Call Option Hedge
- Final Conclusion
- Important Message from Us

Trade Analysis Report: AMD Hedge Shorting Strategy
Trade Details:
- Trade Type: Hedge Shorting
- Asset: Advanced Micro Devices (AMD)
- Shorting Level: Entry at $171
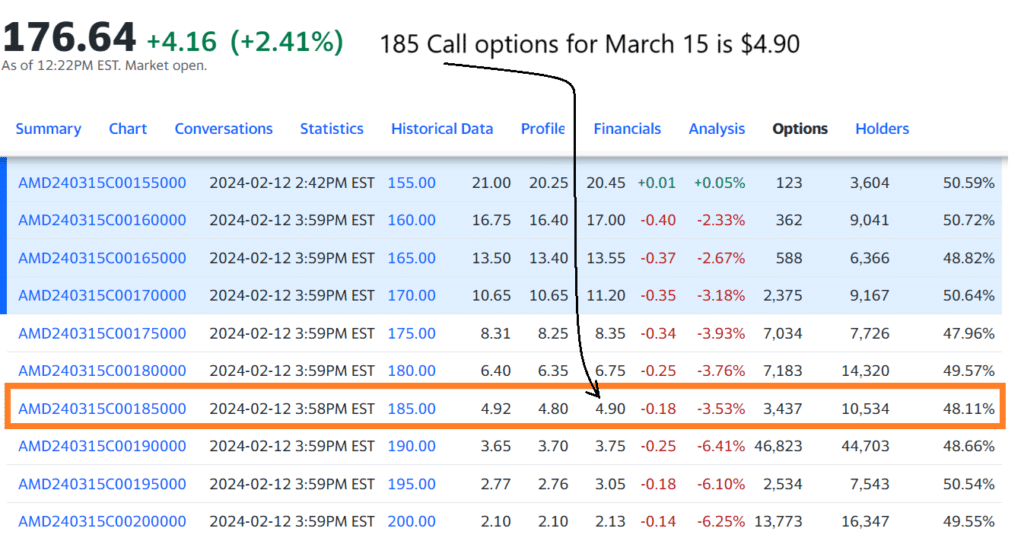
- Hedge Mechanism: Long calls on AMD, March 15/182.5 strike at a premium of $4.90
- Position Structure: 95% investment in shorting AMD shares, complemented by a 5% hedge in long call options
- Duration: The trade is anticipated to unfold over a period of 4 to 12 weeks, with adjustments based on market conditions.
- Expected Risk-Reward Ratio: 2
- Price Target: Setting a short sell price target for AMD at $120, predicated on comprehensive market analysis and AMD’s financial outlook.
Rationale for Hedge Shorting AMD
The decision to initiate a hedge short position on AMD is based on our unique analysis. Here are some factors supporting our analysis: the company's weak performance following its recent earnings announcement on the 30th, potential market trends that have encountered significant milestone resistance levels such as NYSE composites reaching its 2022 peak, and the top 7 companies driving the S&P 500, which have already reached historically high forward P/E levels, even after analysts have raised their high-end earnings expectations for next year. Our earnings forecast model suggests there could be limited upside for these stocks in the near term, but potential economic headwinds might make owning this asset at current levels riskier in early 2024. This trade strategy employs a hedge to mitigate potential losses from unexpected upward market movements, ensuring a balanced risk profile while exploring potential downside risks due to macroeconomic factors.
Risk Management
The structured position, combining a majority short stance with a minor long call option hedge, is designed to manage and limit potential losses. Over the next 4 weeks, we will monitor market dynamics closely. After this period, depending on the trade conditions, each position will either be closed or continued based on the performance of the position and market dynamics. The expected risk-reward ratio of 2 aligns with our strategic risk tolerance, aiming for optimal returns while preserving capital.
Navigating the Heights – A Tactical Shift in Strategy
The scenario sets a compelling stage for the exploration of a short-selling strategy, complemented by the prudent application of options hedging. Such an approach not only acknowledges the critical importance of timing in capitalizing on market adjustments but also underscores the paramount importance of risk management in navigating the volatile waters of stock trading. This report aims to dissect the layers behind AMD's impressive ascent and recent underperformance, juxtaposed against the broader context of a high-performing market, to unveil a strategic pathway that leverages short selling while mitigating risks through options hedging.
As we delve into the intricacies of this hedged short selling strategy, it is crucial to remember that the essence of trading lies not just in recognizing opportunities but in the meticulous orchestration of timing, insight, and risk management to navigate the complex dynamics of the stock market effectively.

AMD's Performance: A Deep Dive into the Rally and Relative Dynamics
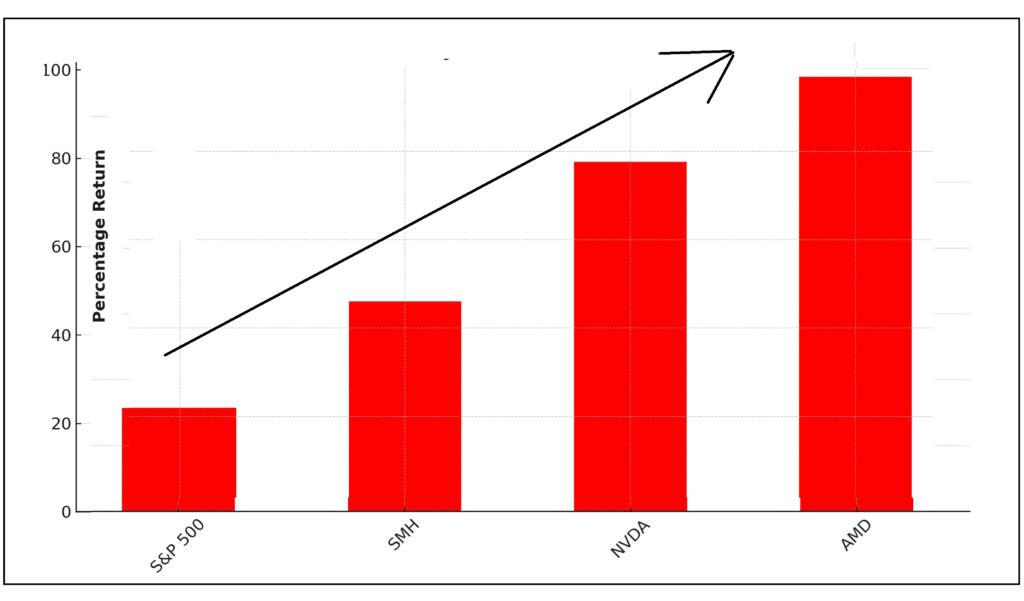
AMD's remarkable journey over the last three months stands as a testament to the company's strong market position and investor confidence. With a 90% increase in stock value, AMD has led the charge in the semiconductor and AI space, showcasing its potential for sustained growth and innovation. This performance is particularly noteworthy when compared to market indices and competitors, including NVDA, traditionally seen as the bellwether for AI-related stocks. AMD's ability to outperform amidst a crowded and competitive landscape underscores its strategic advancements and the market's optimistic outlook on its future prospects.
Market Leadership dynamic during the last 80 days of stock market rally since October 27, 2023
Short Selling in Current Market Conditions
The broader market landscape has been characterized by elevated valuations, fueled by investor excitement surrounding technology and AI-centric growth narratives. In this atmosphere of optimism, specific sectors and equities, AMD included, have witnessed their valuations expand, potentially reaching levels that could be considered overstretched. The bullish sentiment among investors has been primarily propelled by signs of economic resurgence, moderated inflation, and breakthroughs in technology, especially in artificial intelligence (AI), alongside anticipation of the Federal Reserve's potential for five interest rate cuts within the year.
Yet, this optimistic outlook is tempered by underlying concerns. There's apprehension regarding overvaluations and the looming threat that high interest payments might pose to consumer finances, potentially impacting both the broader market and the job market adversely. These issues highlight the complexity of current market dynamics, where enthusiasm for growth intersects with caution over emerging economic and financial challenges.
Recent Underperformance of AMD Shares
Despite the impressive rally, AMD has shown signs of underperformance in the last three weeks, diverging from its previous trajectory of consistent gains. This section analyzes the potential reasons behind this slowdown, considering various technical indicators, market trends, and sector-specific challenges. The recent underperformance could be attributed to market corrections, profit-taking by investors after the substantial rally, or adjustments in investor expectations following the latest earnings report and future guidance. Additionally, broader market dynamics, such as shifts in investor sentiment towards more conservative or diversified investments, could also play a role.
This period of underperformance, juxtaposed against the backdrop of AMD's significant gains, offers a compelling narrative for investors. It prompts a reevaluation of the stock's current valuation, potential market saturation, and the broader implications of rapidly changing investor sentiments. As this section explores, the key to understanding AMD's future trajectory lies in dissecting these layers of performance, market reactions, and underlying sectoral shifts, setting the stage for informed investment strategies amidst a volatile market landscape.
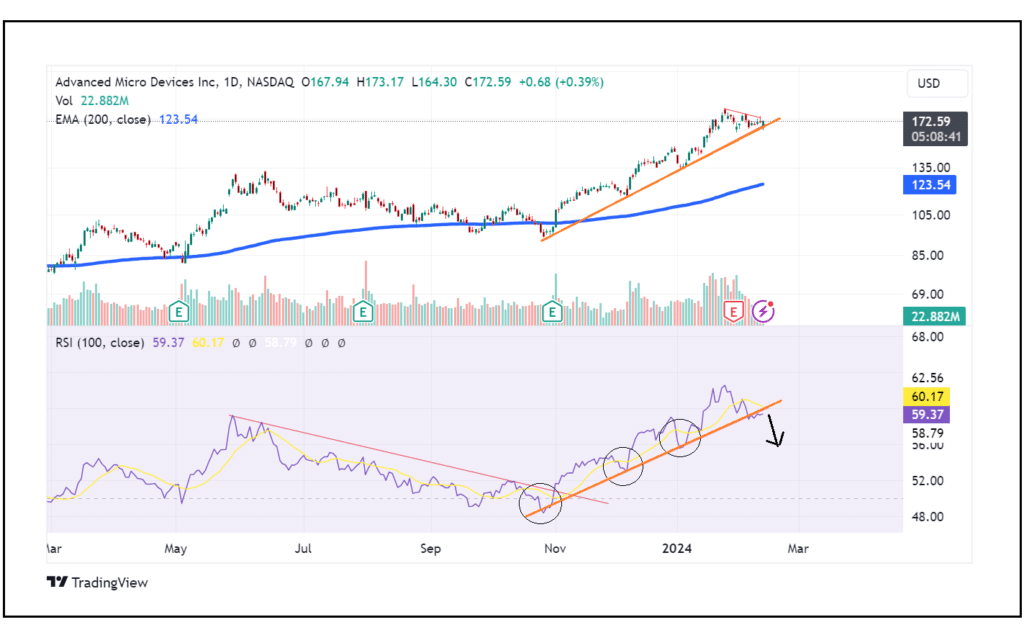
To analyze AMD's recent performance dip and assess its technical trend, we employ a refined method focusing on the Relative Strength Index (RSI) over the past 80 days. By extending RSI analysis to the last 100 days—during which AMD's stock appreciated by 90%—we pivot from viewing RSI as merely an oversold/overbought indicator to a nuanced trend indicator. This analysis reveals a divergence: AMD's price trend continues its ascent, yet its RSI momentum indicates a breach in its uptrend. This discrepancy highlights AMD's waning momentum, suggesting a departure from its strong rally phase, as observed last week.
AMD's Recent Earnings
In AMD's latest earnings report for the fourth quarter and full year of 2023, announced on January 30, 2024, the company showcased significant achievements and strategic advancements, particularly in AI technology and the semiconductor market. AMD reported a revenue of $6.2 billion for the fourth quarter, exceeding expectations with a slight margin over the anticipated $6.13 billion, demonstrating the company's continued growth and operational efficiency. This performance aligns with AMD's focused expansion in AI solutions, from data center applications to PCs, highlighting the launch of AMD Instinct MI300X accelerators and Ryzen 8040 Series mobile processors with integrated neural processing units (NPUs) to accelerate AI workloads.
You can read the official AMD Earnings release below
AMD's emphasis on AI technology was evident, with several strategic announcements made to bolster its presence in this rapidly growing segment. The company's advancements in AI software ecosystems, such as the introduction of the latest version of its open-source ROCm 6 software stack optimized for generative AI, and partnerships with industry leaders like Microsoft, Meta, and Oracle, underscore its commitment to maintaining a competitive edge in AI-driven solutions.
Looking ahead, AMD provided an outlook for the first quarter of 2024, expecting revenue to be approximately $5.4 billion, with a non-GAAP gross margin of about 52%. This forecast suggests a balanced view of its operational dynamics, considering the expected seasonal decline in server sales offset by a strong Data Center GPU ramp, alongside anticipated declines in Client, Embedded, and Gaming segment sales.
Despite the positive reception to its earnings report and strategic advancements in AI, AMD's stock experienced a slight decline of -2.5% the day following the earnings announcement, closing at $167.69. However, in the subsequent days, AMD's stock price adjusted, showing a modest increase of +2.9%, however since earning report stock has underperformed.
Market Leadership dynamic during the last 12 days since AMD earnings on 30th of January 2024.
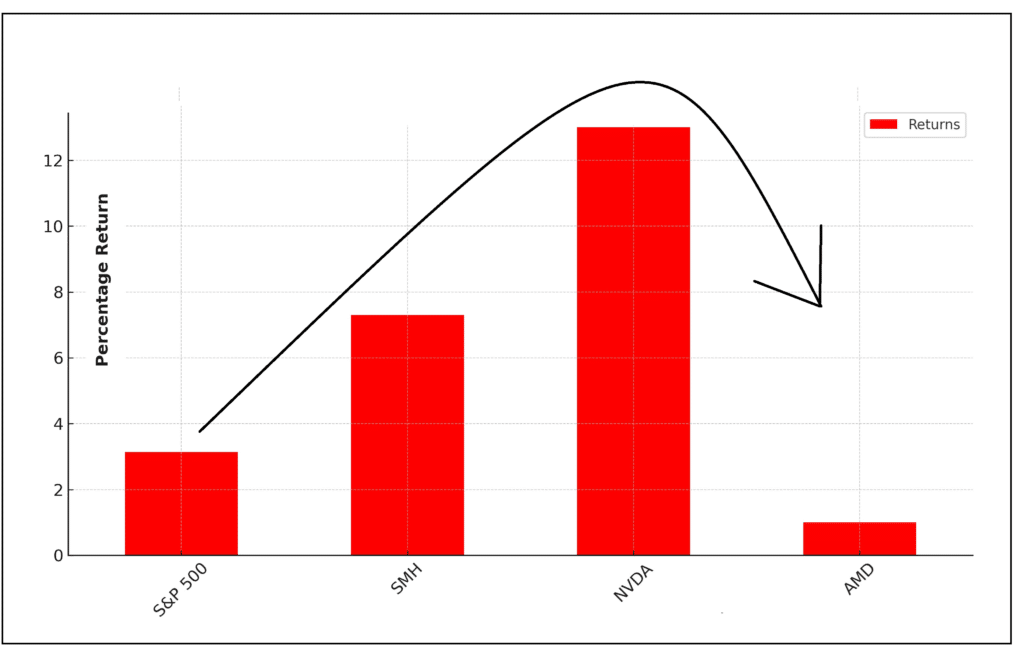
This not so optimistic market behavior reflects a nuanced interpretation of AMD's financial results, strategic direction, and positioning within the broader semiconductor and AI markets, amidst a backdrop of overall market trends where the Nasdaq 100 saw a significant upswing of nearly 7% during the same period while NVDA increased 13%.
A Detailed Examination of Market Dynamics: Unveiling an Important Technical Resistance
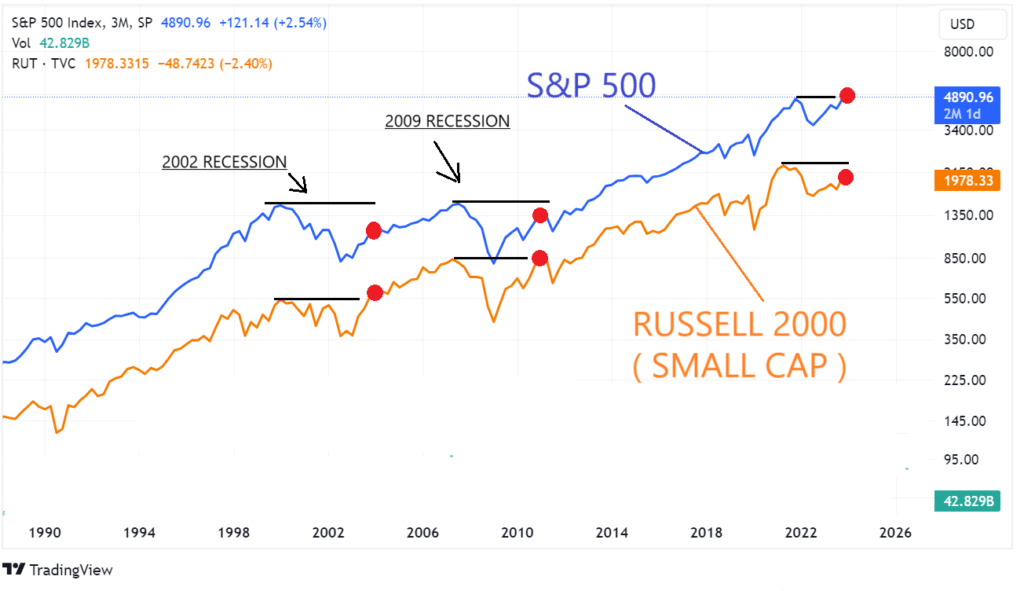
In the realm of market analysis, it is imperative to adopt a holistic view that transcends the conventional focus areas. This study endeavors to shed light on a less-discussed yet critical aspect of the financial markets—the potential for encountering significant resistance levels. Our analysis diverges from mainstream narratives by exploring the implications of performance disparities between small-cap and mid-cap stocks and their reflection on broader economic signals.
Small and mid-cap stocks, often regarded as barometers for domestic economic health due to their sensitivity to local economic conditions, present a compelling narrative. Contrary to expectations of an economic recovery, the current positioning of mid-cap stocks significantly below their historical peaks, coupled with the even more pronounced downturn in small-cap stocks, suggests we may be witnessing the twilight of the current economic cycle rather than its resurgence. This discrepancy underscores a cautious sentiment, indicating that the anticipated broad-based recovery may not be as imminent as some projections suggest.
Correlation between Russell 200 Small Cap index and S&P 500 since 1990

Moreover, a pivotal component of our analysis centers on the New York Stock Exchange (NYSE) Composite Index, a comprehensive gauge consisting of approximately 2,000 respected companies. This index, despite its critical importance in representing the breadth of the American economy, often escapes the spotlight in mainstream financial media discussions. The NYSE Composite stands near a crucial juncture, teetering at its all-time high resistance level. This proximity to a historical threshold underscores the index's role in encapsulating the market's collective sentiment and economic undercurrents.
NYSE Composite: a sideways channel since 2022 January
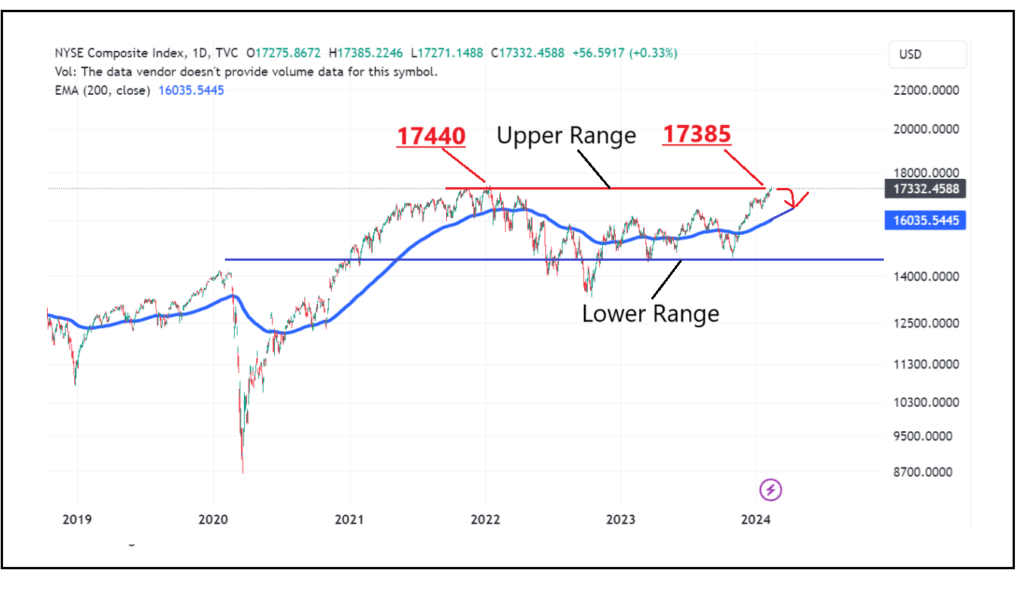
The significance of this resistance level cannot be overstated. Surpassing it would necessitate not only broader market participation but also the emergence of positive market catalysts that could alter the current trajectory. Our analysis, informed by the behavior of the NYSE Composite, posits that the market is currently navigating a delicate equilibrium. The index's performance over the past three years, characterized by a sideways trading range, culminates in the present scenario where it approaches the upper boundary of this range as of February 2024.
This nuanced perspective, derived from an in-depth examination of small and mid-cap stocks alongside the NYSE Composite, offers a unique vantage point. It suggests that the market's current stance, on the cusp of potentially overcoming a significant resistance level, reflects a broader economic narrative. The real picture of the economy, as depicted by the NYSE Composite, suggests a balanced yet cautious market environment, awaiting definitive signals to define its forthcoming direction.
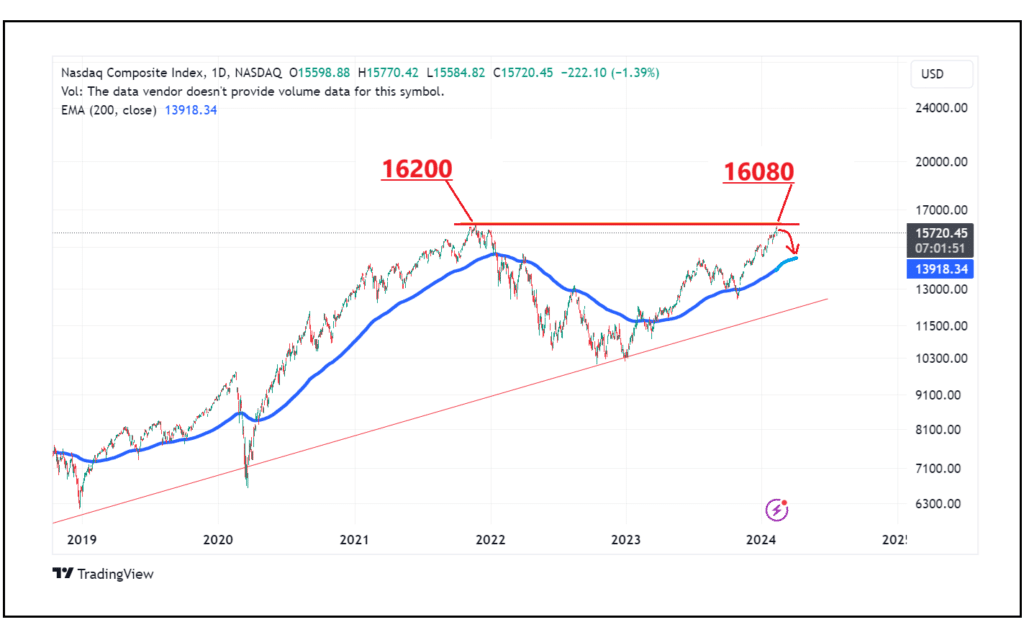
Nasdaq Composite also mirrors NYSE's picture.
Bubble like sentiment on AI stocks
The increasing attention on AI investment trends and the media's focus on high-profile bets in AI sectors have raised concerns. This trend is particularly notable as there was no similar encouragement to invest in AI or semiconductor stocks, like the SMH ETF when it was trading around $140 three months ago. This market dynamic underscores the need for timely and strategic investment advice, often missed by the broader public until after significant movements have occurred.

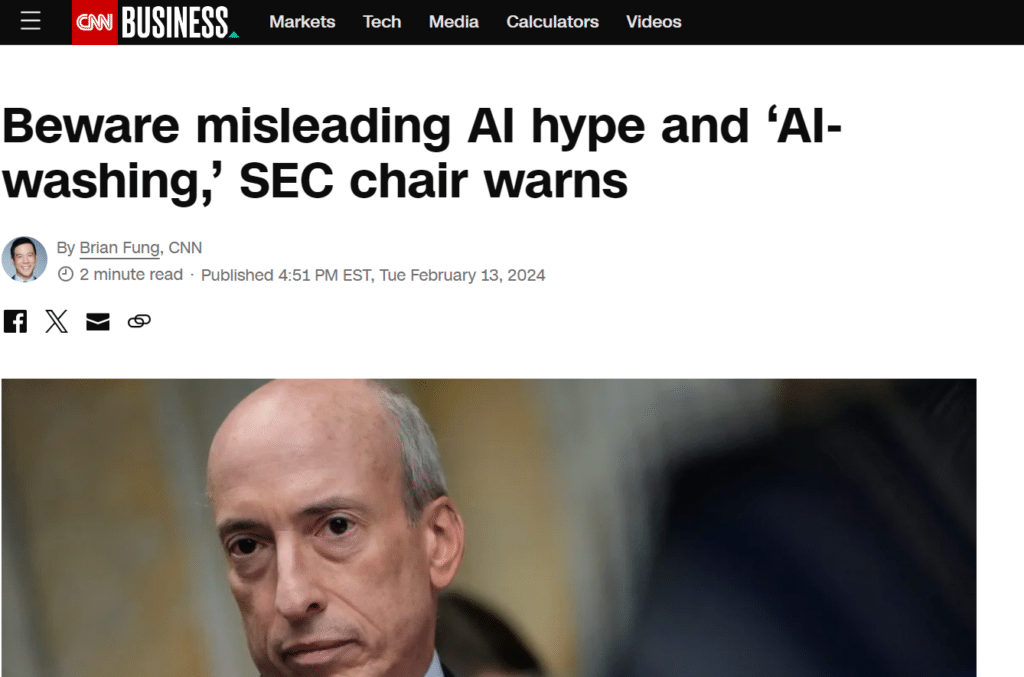
SEC comments about AI washing
The surge in AI companies and stories has fueled a bubble-like sentiment, attracting widespread attention, including that of regulatory bodies like the SEC. This phenomenon underscores the market's heightened interest and speculative behavior surrounding AI advancements.
Strategizing AMD's Short-Sell: Analyzing Risks and Rewards with a Call Option Hedge
In the following analysis, we'll delve into a tactical short-selling strategy for AMD stock, complemented by a call option hedge over the upcoming four weeks. Our focus will be on evaluating the strategy under two distinct scenarios: the first, a 'negative-case' where our analysis misses the mark and AMD's stock continues its upward trajectory; and the second, a 'best-case' where our predictions hold true, resulting in AMD's stock value declining within the specified timeframe.
This thorough examination aims to illuminate both the potential risks and rewards associated with this tactical trade. By considering the outcomes under varying market conditions, we intend to provide a comprehensive overview of what traders might expect, facilitating informed decision-making based on a balanced view of potential gains versus losses. Through this approach, investors can better understand the strategic nuances of short selling AMD, armed with a hedging mechanism to navigate market uncertainties
Initial Portfolio Allocation:
This thorough examination aims to illuminate both the potential risks and rewards associated with this tactical trade. By considering the outcomes under varying market conditions, we intend to provide a comprehensive overview of what traders might expect, facilitating informed decision-making based on a balanced view of potential gains versus losses. Through this approach, investors can better understand the strategic nuances of short selling AMD, armed with a hedging mechanism to navigate market uncertainties
Total Portfolio: $100
Short Position Allocation: 95% of $100 = $95
Call Option Hedge Allocation: 5% of $100 = $5
( 182.5 March 15th Calls)
Date: 2/13/2024
The first, a 'negative-case'
Call Option Outcome:
- You purchased call options with a $182.5 strike price for $5, which would theoretically control shares worth $5 at the purchase time.
- If the stock price increases to $200, the intrinsic value of the call option becomes $17.5 (i.e., $200 – $182.5).
- Since you’re considering the call options to convert $5 into $17.5, we calculate the profit from the call options.
Short Position Outcome:
- You shorted the stock at $173.
- The stock price rises to $200.
- The loss per share on the short position = $200 – $173 = $27.
- To calculate how this affects the $95 allocated to the short position, we need the number of shares shorted. However, we’ll assume the portfolio value directly decreases in proportion to the stock price increase for simplicity.
Calculating the Net Effect:
- The loss from the short position needs to be calculated based on the increase in stock price and how that depletes the $95 short position value.
- The gain from the call options is straightforward as you’ve outlined ($5 turns into $17.5, netting a $12.5 profit).
Let's calculate the net effect on the portfolio if the stock price increases to $200, particularly focusing on the short position loss and how the call option contributes to offsetting this loss.
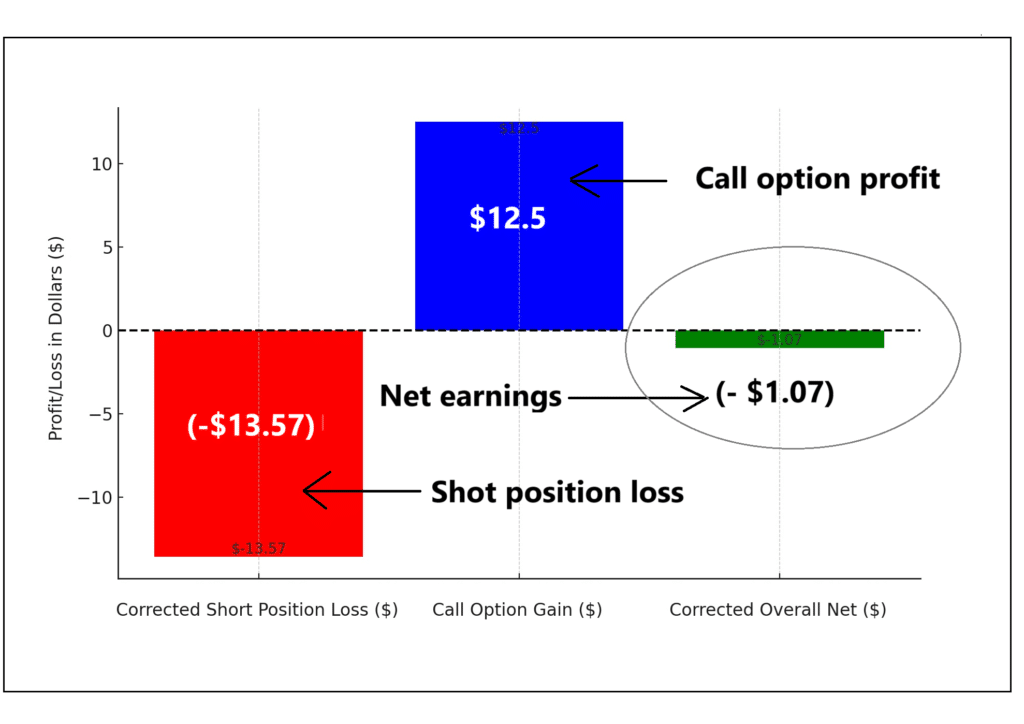
Based on the calculations:
- The new value of the short position, after accounting for the loss due to the stock price increase, is approximately $80.17.
- The sale value from the call option, based on its intrinsic value, is $17.5.
- After combining the adjusted short position value and the proceeds from selling the call option, the total portfolio value comes to approximately $98.93
- This results in a portfolio decrease of about 1%, even though the stock price went against the short position by a significant margin.
Therefore, with the stock price moving from $175 to $200, this hedging strategy using call options limits the loss to a smaller percentage of the portfolio compared to the potential loss from the short position alone. However, there is another negative site for this strategy which could create larger losses for the hedge site of the trade.
"Sideways Trading Scenario: Analyzing the Impact on AMD Short Strategy and Option Hedging"
An alternative negative scenario for the AMD short strategy could involve the stock trading sideways within the $175 - 185 range and closing the around 182.5 level at the end of option expiration on March 15th. In such a case, the entire time value of the options might erode, leading to the loss of the $5 options premium without any significant movement in the stock price.
This situation results in a loss equivalent to the option premium, approximately 5% of the trade position, and also another 5% from the short position totaling a 10% negative outcome for the position. This could represent a less favorable outcome, where the lack of clear market direction prevents the short position from generating profits. Instead, the hedge option could lose its time value and expire worthless, resulting in a loss for the trade. In our analysis, this scenario might be considered the least desirable, given the structure of this trade, as it leads to a financial setback without the benefit of capitalizing on market movements.

The second, a 'best-case'
In the optimized trading scenario, AMD's stock price declines from $170 to $120 in the next couple of months, and the short position initially established with a $95 investment takes advantage of this more significant price movement. This $50 decrease in stock price per share leads to a gross profit of approximately $27.94, based on shorting around 0.56 shares at the initial price, under the simplified assumption of no leverage.
To offset the risk, an option position was deployed as a hedge, with a cost of $5. Consequently, the net profit from this trade, after factoring in the hedging cost, stands at approximately $22.94. This example illustrates the enhanced profitability potential within our strategic approach, underlining the value of effective risk management through options hedging.
Final Conclusion
Comparatively, in the worst-case scenario—where our analysis does not align with market movements, leading to a potential $10 loss on the $100 sample trade position—the risk-to-reward ratio stands at 2.
In the realm of financial markets, identifying precise entry and exit points remains a formidable challenge, particularly in terms of accurately predicting market tops and troughs. A widely accepted principle among investors is to align strategies with prevailing market trends, given their potent influence on asset price movements. However, adopting a contrarian stance—deliberately opposing the consensus—can offer substantial rewards, albeit accompanied by commensurately higher risks.
This analysis endeavors to employ a contrarian approach in today’s tactical trade examination, aiming to capitalize on potential rewards while conscientiously mitigating risks through strategic hedging. This methodology aspires to establish a balanced trading position, diverging from the predominant sentiment of Wall Street analysts, who have recently escalated their earnings forecasts for leading Nasdaq-listed entities such as Meta and Amazon. These revised projections have, in turn, elevated market expectations for the forthcoming fiscal year, contributing to an upward trajectory in market valuations.
Critically, historical patterns suggest that analysts' forecasts, particularly concerning market peaks and troughs, frequently deviate from subsequent outcomes. Their tendency to adjust expectations—elevating them during bullish phases and diminishing them amidst bearish trends—underscores the speculative nature of such forecasts. The current analysis posits that the first quarter of 2024 presents a scenario analogous to historical precedents, where market technicals exhibit robust strength, evidenced by the attainment of new highs following the breach of significant long-term resistance levels. At first glance, this scenario might suggest a favorable economic outlook, potentially justifying the market's forward-pricing of optimistic projections.
However, a comprehensive examination of fundamental indicators reveals a more nuanced picture. Persistent inflationary pressures pose a tangible risk to the market as the economy gains momentum. Moreover, the implications of the Federal Reserve's interest rate policies on consumer spending are becoming increasingly pronounced, with elevated interest obligations exerting financial strain on households.
In summary, the prevailing economic landscape, while superficially robust, harbors underlying vulnerabilities that may not be fully appreciated by the market. This analysis advocates for a tactical contrarian investment in an Artificial Intelligence (AI) stock that has gained considerable attention recently. The rationale is predicated on the expectation that the economic horizon will undergo a transformation, prompting a realignment of momentum-driven trades.
This shift could precipitate a decline in stocks that have experienced substantial appreciation—ranging from 70 to 90% over a three-month period. Such a strategic approach underscores the importance of discerning the intricate balance between macroeconomic factors and market sentiment, aiming to leverage contrarian insights for tactical advantage in a complex and evolving financial landscape.
Important Message from Us
As we conclude our trade analysis for February, I wish to emphasize that the case study presented in this article serves as an illustrative example and is intended solely for informational purposes. Hedging a trade with options necessitates meticulous monitoring of the option's premium. At the time of writing this article, on February 13, 2024, the prices of the options and AMD stock may vary from those at the moment you read this. Consequently, the effectiveness of the hedge might also differ. Therefore, it's crucial to obtain up-to-date information and conduct a thorough analysis with your financial advisor.
Our primary objective is to provide you with a perspective that we believe will guide you towards the right direction for exploring potential opportunities and determining their value.
Warm Regards
Sam Sacli
Market Behavioral Research Department
Scholarch Research
CONTACT US
The Scholarch LLC
1111B Governors Ave. STE 7059 Dover, DE 19904
research@thescholarch.com
Disclaimer: The Scholarch Reports upholds the highest standards of integrity and transparency in all its publications. We unequivocally assert that the content within our research articles is authentic and genuine, steadfastly adhering to the principles of impartiality and objectivity. Our commentary and analysis are conducted disinterestedly, devoid of any personal or financial interests that might potentially skew our evaluations. It is our policy not to invest in the stock ideas we report on. Should an exception arise, it will be clearly disclosed at the conclusion of our reports or articles. The insights and assessments provided in our research articles and reports are the culmination of meticulous research, intended solely for informational and educational purposes. They are not promotional in nature and should not be interpreted as an endorsement or solicitation to buy or sell any stocks, financial products, or services. The content provided on our website or in our reports does not constitute investment advice or an endorsement of any specific investment strategy. While we endeavor to provide accurate and up-to-date information, The Scholarch LLC and its affiliates do not guarantee its completeness or accuracy. We shall not be held accountable for any losses incurred from reliance on this information. Past performance is not a reliable indicator of future results. Readers are strongly advised to conduct their own due diligence and consult with a professional advisor before making any investment decisions. The Scholarch LLC does not possess a financial advisory license and therefore does not offer personalized financial advice. This website and our reports may include links to third-party websites and information; The Scholarch LLC is not liable for their content or accuracy. We appreciate your trust in The Scholarch Reports. Thank you for reading our disclaimer.