NDX Summation Index: Distribution Stage Has Started?
- Publication Date: 02/18/2024
Executive Summary
In this brief research note, we aim to highlight a few key developments in market technicals that warrant your attention, ideally in a timely fashion. Market technicals play a crucial role because, while fundamentals drive the market, technical analysis aids in understanding the timing mechanisms of these movements. These tools are instrumental in determining when fundamental changes will meaningfully reflect in prices. Today, we focus on market breadth indicators and their correlation with major composite indexes, which encompass a broad spectrum of U.S. equities under their umbrella.
In this professional overview, we turn our focus to a detailed analysis of the Summation Index, reviewed on a weekly basis. Our spotlight shines on the weekly Summation Index, offering a nuanced understanding of market cycle movements. Amidst digesting a mix of earnings reports, where we observed both positive developments and areas of concern, attention has also been drawn to notable upgrades among the top 7 stocks within the Nasdaq 100. However, our analysis extends beyond to a broader vista, centering on the Nasdaq Composite which holds most of the tech names in US economy behind top 7 names.

Broader Market Insights: Composites vs. NASDAQ 100 and S&P 500
Unlike the Nasdaq 100 and S&P 500, the Nasdaq Composite provides a comprehensive view, encompassing over 2,500 companies. Remarkably, as of last week, this index has achieved a milestone by reaching its all-time high, a peak last seen two years ago. This achievement comes in the wake of the Nasdaq 100 and S&P 500 surpassing their all-time highs four weeks prior, a feat not immediately mirrored by broader composites such as the Nasdaq and NYSE, which have only recently approached these critical resistance levels.
Furthermore, we delve into the Summation Index for the Nasdaq (NDX), which has shown a declining trend since January. This period coincides with the initial release of disappointing inflation data, further compounded by a second wave of concerning figures last week. This negative trajectory in the Summation Index underscores a significant downturn in market breadth since the start of the year, highlighting investor sentiment and market dynamics in response to inflationary pressures.
Understanding Market Cycles: The Role of the Summation Index
The Summation Index is a comprehensive market breadth indicator that aggregates the net advances (the number of advancing stocks minus the number of declining stocks) over a specific period. It is derived from the Advance/Decline Line and is typically smoothed with a moving average to highlight longer-term market trends. The importance of the Summation Index lies in its ability to provide insights into the underlying strength or weakness of the market, especially when you monitor it from a weekly point of view.
A rising Summation Index suggests that a broad base of stocks is participating in the market's upward movement, indicating strong market breadth and reinforcing the sustainability of a bullish trend. Conversely, a declining Summation Index, even as the market rallies, signals that fewer stocks are driving the market's gains. This condition often points to weakening market breadth, suggesting that the rally may be more vulnerable to reversals.
Hence, the Summation Index proves indispensable for both investors and analysts, affording a profound insight into the genuine cyclical phases of the market, be it accumulation or distribution, far surpassing mere superficial price trends. It aids in discerning the extent to which a market's rally or downturn is underpinned by the collective movements of individual stocks, offering crucial hints at the market's impending cyclical direction. To learn more about the Summation index, click the Investopedia article below.

Summation Index: Deciphering the Market's Current Phase
Let's take a focused look at the market purely through the lens of the Summation Index, setting aside the trends observed in recent weeks. This approach allows us to understand the market's underlying dynamics without being misled by price discrepancies that often arise during periods of uncertainty. Following the earnings announcements from top Nasdaq companies like META, AMZN, and NVDA, the indexes have surged, fueled by the AI boom and optimistic analyst forecasts. These adjustments, based on enhanced earnings expectations post-conference calls, have propelled these key stocks, significantly impacting the Nasdaq 100 and S&P 500's momentum.
However, despite the bullish appearance, it's crucial to question if this truly reflects the market's behavior as we navigate a bull cycle's markup stage. By concentrating on the Nasdaq 100 Summation Index rather than just the Nasdaq 100, we gain deeper insight into the market's current phase, offering a clearer perspective on its actual state and potential trajectory.
Weekly NDX Summation Index since Oct '21
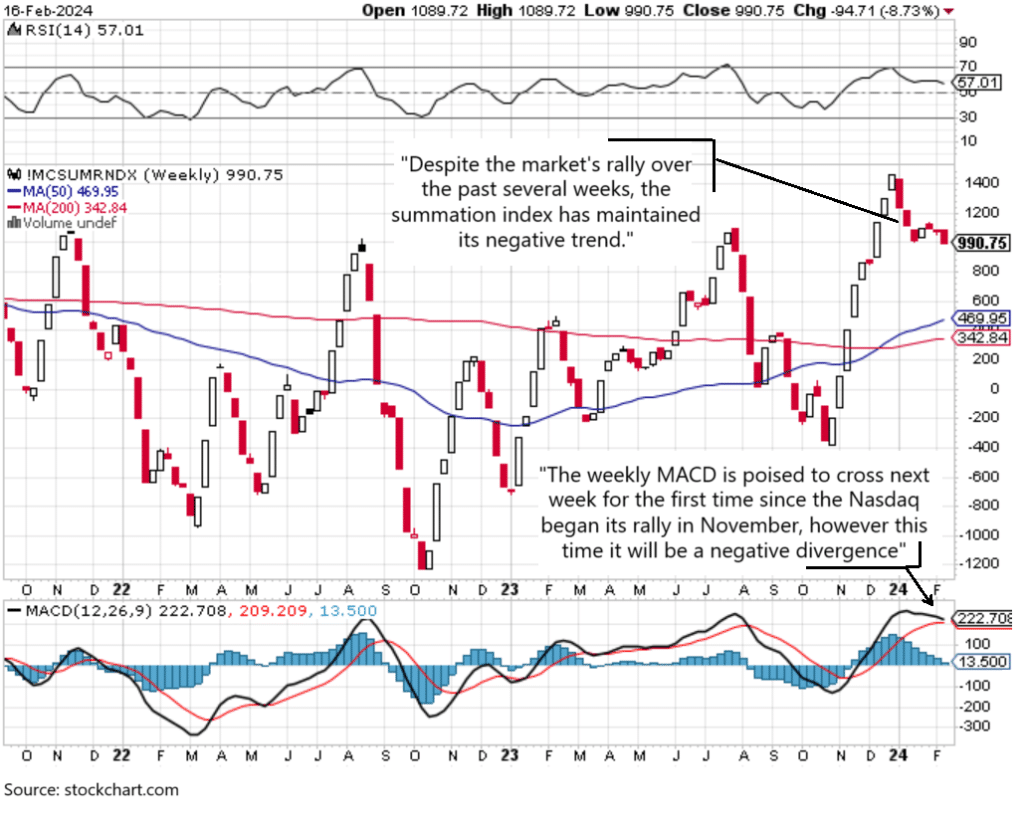
Observing the Nasdaq 100 weekly Summation Index, we note a marked decline in market breadth since early January, coinciding with the first disappointing inflation data. This period saw the S&P 500 challenging a critical all-time high resistance level at 4800. Since then, both the S&P 500 and Nasdaq 100 have ascended by over 5%. However, this rise contrasts with a significant drop in the Summation Index, especially following a second wave of negative inflation data on February 13th this week. Despite the indexes' resilience, the Summation Index's further decline signals a concerning trend: while a few stocks propel the indexes upward, the broader market within the Nasdaq 100 portfolio is experiencing selling pressure.
Insights and Implications
This pattern indicates a transition beyond the markup phase, signaling a shift towards disruption or distribution. Distribution phases can vary in length, shaped by market dynamics and the unfolding of fundamental news that affects the economic outlook. Presently, the Summation Index suggests we are in a distribution stage, marked by a few large-cap liquid stocks driving the market upwards while less liquid, more vulnerable stocks are being sold off during the market’s recent rallies due to their illiquidity. This refined perspective on market stages emphasizes the need to delve deeper than just surface-level index movements to truly understand the underlying market sentiment and directional trends.
Conclusion
As we approach a pivotal week featuring the Federal Reserve's minutes and top AI earnings from companies like NVDA, we observe the market's resilience, particularly in how it continues to rally around key stocks. This observation, when viewed through the lens of broader fundamentals, reveals that the current mild economic growth—though beneficial for top tech stocks—does not uniformly enhance the well-being of the average US consumer, benefiting only select groups. Such a trend raises concerns for long-term economic health.
This week, as the Nasdaq Composite hit an all-time high, market behaviors suggest an onset of early distribution patterns. In these scenarios, liquid assets are often leveraged to window-dress portfolios, facilitating the sale of less liquid ones—a narrative aptly depicted by the current Summation Index readings. However, it's crucial to note that relying solely on the Summation Index for market analysis can be misleading. A comprehensive understanding of market stages requires an in-depth analysis of the economy and the myriad dynamics that influence financial markets.
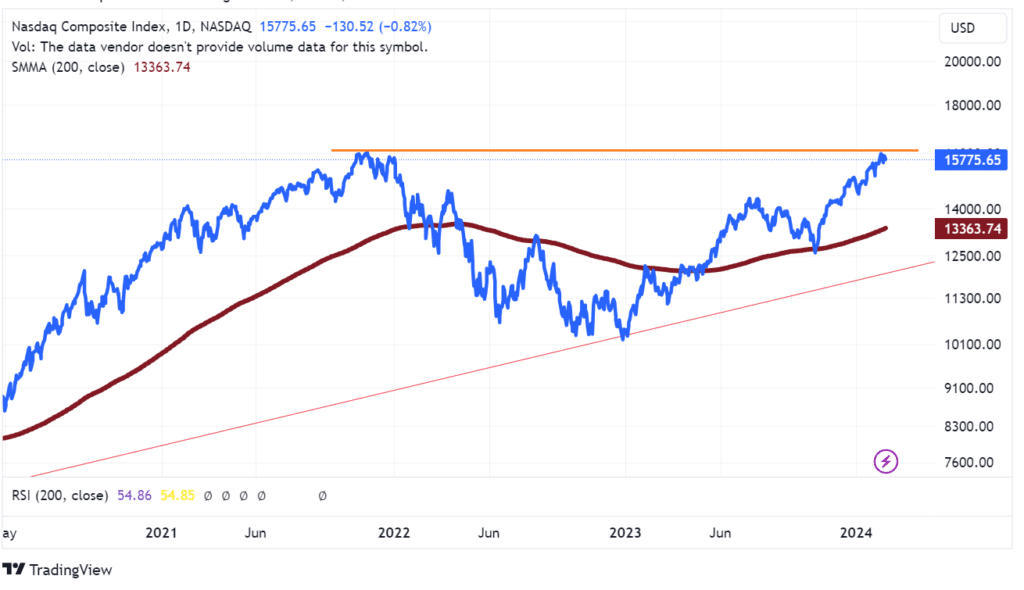
Currently, the Nasdaq Composite encounters significant resistance as you can see from the above chart, while the Nasdaq 100 Summation index shows a negative trend in market internals, suggesting the market may be in a distribution stage rather than a markup phase with upward potential. Understanding these market movements requires a sophisticated approach that goes beyond basic analytics, involving a deep dive into economic indicators, investor sentiment, and global trends. Such comprehensive analysis demands blending quantitative data with qualitative insights to accurately gauge market directions and outcomes.
Warm Regards
Sam Sacli
Editor
CONTACT US
The Scholarch LLC
1111B Governors Ave. STE 7059 Dover, DE 19904
research@thescholarch.com
Disclaimer: The Scholarch Reports upholds the highest standards of integrity and transparency in all its publications. We unequivocally assert that the content within our research articles is authentic and genuine, steadfastly adhering to the principles of impartiality and objectivity. Our commentary and analysis are conducted disinterestedly, devoid of any personal or financial interests that might potentially skew our evaluations. It is our policy not to invest in the stock ideas we report on. Should an exception arise, it will be clearly disclosed at the conclusion of our reports or articles. The insights and assessments provided in our research articles and reports are the culmination of meticulous research, intended solely for informational and educational purposes. They are not promotional in nature and should not be interpreted as an endorsement or solicitation to buy or sell any stocks, financial products, or services. The content provided on our website or in our reports does not constitute investment advice or an endorsement of any specific investment strategy. While we endeavor to provide accurate and up-to-date information, The Scholarch LLC and its affiliates do not guarantee its completeness or accuracy. We shall not be held accountable for any losses incurred from reliance on this information. Past performance is not a reliable indicator of future results. Readers are strongly advised to conduct their own due diligence and consult with a professional advisor before making any investment decisions. The Scholarch LLC does not possess a financial advisory license and therefore does not offer personalized financial advice. This website and our reports may include links to third-party websites and information; The Scholarch LLC is not liable for their content or accuracy. We appreciate your trust in The Scholarch Reports. Thank you for reading our disclaimer.