Revisions to PCE Data: Implications for FED Policy Decisions
- Publication Date: 03/03/2024
Update Summary
We would like to provide a brief update on our opinion note regarding the Personal Consumption Expenditures (PCE) data, which was published two days ago, one day ahead of the PCE data release on 2/28/2024. You can access the article via the link provided below.
In summary, we had anticipated investors would be gaining a clearer understanding of inflation dynamics from this release. However, the PCE data has since been reported in line with expectations, contrary to our forecast. This discrepancy prompts us to emphasize a crucial aspect of PCE data releases that can potentially paint a misleading picture of inflation.
The Personal Consumption Expenditures (PCE) data, which was expected to rise by 0.3% in January, did indeed meet these expectations. However, upon thorough analysis, it becomes apparent that the reported 0.3% increase for January slightly deviates from our projections for PCE figures this week. We had anticipated a more significant increase of around 0.8%. It's worth noting that such discrepancies are not uncommon in PCE data releases, particularly during volatile inflationary periods.
Unlike the Consumer Price Index (CPI), PCE inflation rates, including core PCE inflation, are subject to revisions, along with all components of national income and product accounts. While some may argue for relying on CPI inflation rates due to their lack of revision, the revisions to PCE inflation rates stem from additional source data that provide a more accurate depiction of personal consumption expenditures and its breakdown between real consumption and changes in consumer prices.

For instance, consider the core PCE inflation rate in May 2002 on the below chart, which appeared to sharply decline at the time. However, as subsequent 1st revision showed in December 2003, this initial decline was mitigated.
Historical Perspective on PCE Data Revisions from 2000 to 2005
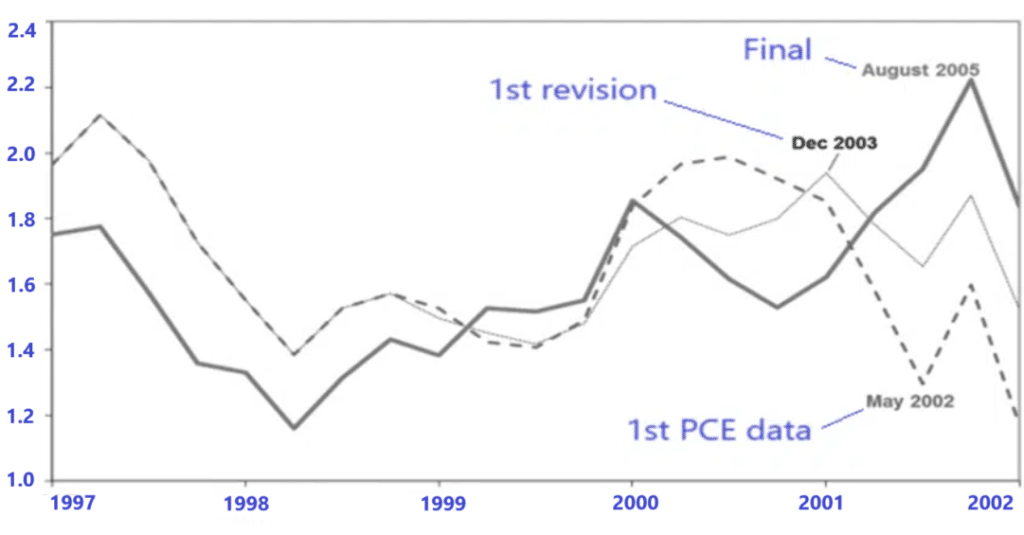
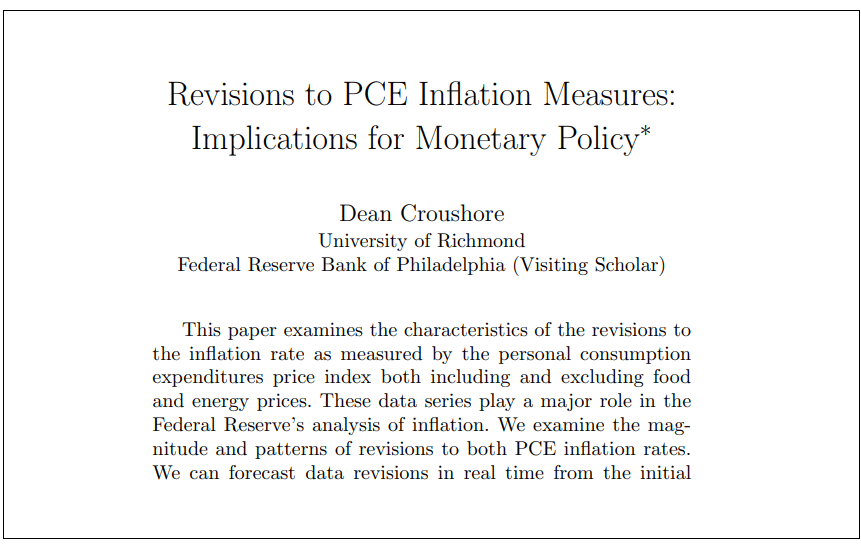
Source: Dean Croushore’s paper – University of Richmond
Worries about inflation in early 2002 dissipated as revisions in December 2003 indicated an upward adjustment to inflation figures from 2001 to early 2002. Subsequent data indicated a rise in inflation from 2000 to late 2001 in the final reading of 2005.
You can delve into Dean Croushore's paper from the University of Richmond, which explores the revisions to PCE data and their implications for monetary policy, by clicking the paper below.
Catalysts for Anticipating Upward Revisions in PCE Data
Our expectation for upward revisions in PCE data is supported by recent observations, particularly when considering the Trimmed PCE data for January. The Trimmed Mean PCE inflation rate, crafted by the Federal Reserve Bank of Dallas, offers an alternative lens through which to gauge core inflation within the price index for personal consumption expenditures (PCE). This data series, meticulously computed by the Dallas Fed using Bureau of Economic Analysis (BEA) data, involves sorting individual components of personal consumption expenditures based on their price changes, then trimming a fraction of the most extreme observations on both ends of the spectrum. The resulting trimmed mean inflation rate serves as a proxy for true core PCE inflation, outperforming conventional measures that exclude food and energy.
To view the alternative trimmed inflation chart from the St. Louis Fed website, please click on the chart below.
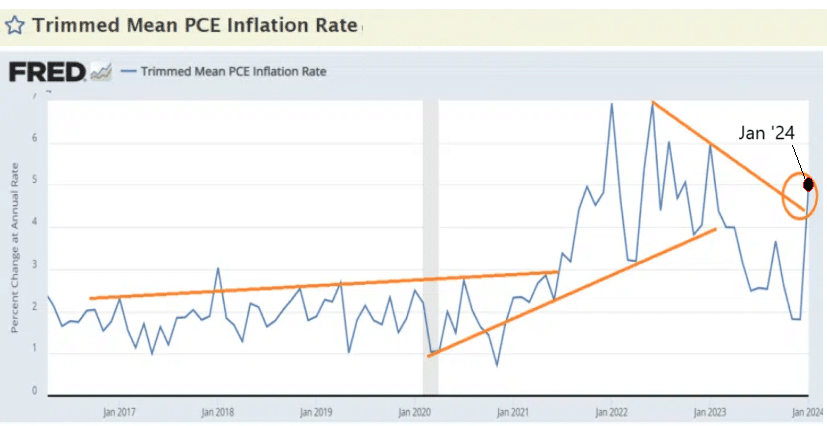
The analysis of this alternative approach unveils a significant surge in volatility towards the upside during January, marking the most notable increase since mid-2022. During that period, a substantial swing in data occurred, coinciding with a shift in inflation from an upward trend to a downtrend. Now, similar patterns of substantial swings are emerging, hinting at potential shifts in the dynamics of inflationary elements. This observation aligns seamlessly with our comprehensive assessment of the inflationary landscape, indicating a trend towards an upward trajectory in general inflation trends.
This shift can be attributed to escalating geopolitical risks, uncertainties surrounding elections in the US, and historically high levels of liquidity that have driven stock prices higher, fueled by expectations of further easing by the Fed into the elevated level of M2 money supply, along with their psychological impacts on consumer and corporate behaviors.
Conclusion
In conclusion, our analysis suggests that the recent core PCE data may not currently reflect the true indicators of real PCE figures, potentially necessitating upward revisions in the future. This is especially notable given the significant volatility observed in the Trimmed PCE data towards the upside. Such discrepancies indicate that the current data may not accurately capture the inflationary dynamics within the market, emphasizing the vulnerability of PCE data to errors. This underscores the importance of diligently scrutinizing economic indicators and adopting supplementary measures to fully grasp and interpret the comprehensive extent of inflationary trends in the market.
Warm Regards
Sam Sacli
Editor
CONTACT US
The Scholarch LLC
1111B Governors Ave. STE 7059 Dover, DE 19904
research@thescholarch.com
Disclaimer: The Scholarch Reports upholds the highest standards of integrity and transparency in all its publications. We unequivocally assert that the content within our research articles is authentic and genuine, steadfastly adhering to the principles of impartiality and objectivity. Our commentary and analysis are conducted disinterestedly, devoid of any personal or financial interests that might potentially skew our evaluations. It is our policy not to invest in the stock ideas we report on. Should an exception arise, it will be clearly disclosed at the conclusion of our reports or articles. The insights and assessments provided in our research articles and reports are the culmination of meticulous research, intended solely for informational and educational purposes. They are not promotional in nature and should not be interpreted as an endorsement or solicitation to buy or sell any stocks, financial products, or services. The content provided on our website or in our reports does not constitute investment advice or an endorsement of any specific investment strategy. While we endeavor to provide accurate and up-to-date information, The Scholarch LLC and its affiliates do not guarantee its completeness or accuracy. We shall not be held accountable for any losses incurred from reliance on this information. Past performance is not a reliable indicator of future results. Readers are strongly advised to conduct their own due diligence and consult with a professional advisor before making any investment decisions. The Scholarch LLC does not possess a financial advisory license and therefore does not offer personalized financial advice. This website and our reports may include links to third-party websites and information; The Scholarch LLC is not liable for their content or accuracy. We appreciate your trust in The Scholarch Reports. Thank you for reading our disclaimer.