"Apple's Latest Earnings Reveal: A Cautionary Signal for Tech
- Publication Date: 02/02/2024
Executive Summary
Delving into Apple's earnings for the first quarter of 2024, our latest article offers a deep dive into the financials that were publicly released on February 2, 2024. These earnings are a critical barometer for understanding stock market trends and gauging the overall economic climate. Despite surpassing revenue projections with $119.6 billion and showcasing strong iPhone sales, the challenges faced in the Chinese market—a significant component of Apple's global sales—shed light on possible economic slowdowns and instability in the tech sector.
"As we begin our analysis, we would like to direct your attention to Apple's earnings announcement. Simply click on the headline below to access the official earnings release directly from Apple's website."
Our comprehensive analysis of Apple's earnings includes its softening sales growth trend and its potential market consequences, providing invaluable insights for those keen on stock market dynamics. Read on to grasp how Apple's earnings could influence the trajectory of the tech industry in 2024 amid widespread economic uncertainties.
Apple's Earnings: A Precursor to Market Shifts
Apple, a Bellwether of the Tech Sector
As the world’s largest company by market capitalization, Apple’s earnings and financial health are often seen as a barometer for the broader stock market, particularly in the technology sector. With a staggering market cap of $3 trillion and accounting for about 10% of the Nasdaq 100, Apple’s performance can significantly influence market trends.
Recent Apple’s Earnings: A Mixed Bag
Apple’s latest quarterly earnings surpassed analysts’ expectations with impressive iPhone sales. The revenue stood at $119.6 billion, with earnings per share reaching $2.18. However, despite these strong figures, there were underlying concerns, particularly regarding Apple’s business in China, which accounts for a significant portion of its sales. The lower-than-anticipated sales in China, at $20.8 billion against the expected $23.5 billion, have raised eyebrows among investors and market analysts.
China: The Crux of Concern
China, being Apple’s third-largest market, is crucial for its global revenue. The recent earnings indicate a troubling trend in this vital region, attributed partly to a sluggish Chinese economy and competition from Huawei. This decline in Chinese market sales could be a forewarning of broader economic challenges, reflecting issues like higher energy prices, geopolitical tensions, and the ongoing war in Ukraine.
Implications for the Tech Sector and Economy
Apple’s earnings and its situation is a microcosm of the broader tech sector’s challenges. With a potential economic slowdown and issues like high energy prices, political uncertainties in the U.S., and global tensions, there is a growing concern that the tech sector could face a downtrend in 2024.
Fed Rates and the Ripple Effect
The dynamics of slowing sales growth, like those seen in Apple’s earnings report, could influence the Federal Reserve’s approach to interest rates. Higher rates might be a response to combat inflationary pressures, which could further impact consumer spending and tech sector investments.
Long-term Outlook for Apple’s Earnings: Caution Ahead
Investors and market analysts are approaching Apple’s stock with caution. The company’s future growth prospects, particularly concerning iPhone sales and the adoption of AI technology, are critical factors to watch. For long-term investors, the current market scenario might present an opportunity to invest at more favorable prices to Apple stock in 2025.
Deciphering Market Trends: Unveiling the S&P 500's Secular Movements and Apple's Growth Trajectory
I'd like to highlight an intriguing perspective that merges fundamental analysis with long-term technical dynamics. This approach is vital because, although fundamentals are essential, the timing of their development can often be tracked through technical observations. To illustrate this, I'll share an analysis technique I developed during my earlier years as an investment advisor in California. This method is unique as it enables us to understand the dynamics of price action in conjunction with its long-term trend.
To effectively analyze the economy, we need to view the S&P 500 through a lens of secular trends. The current secular trend, which began around 2010, has driven many large tech stocks to gain over 300% in returns, with Apple achieving even greater returns within these 14 years. We can delve deeper into this by examining the 200-Quarter Relative Strength Index (RSI) of the S&P 500. This analysis, which reflects each quarter's relative performance over the past 50 years, becomes a mirror for economic cycles through its RSI study.
I plan to write a comprehensive article on how accurately this method has predicted trends over the last century. But for now, let's focus on the current market rally since October 2022, which led the market to new all-time highs. Interestingly, during this period, the 200-Quarter RSI index barely shifted. For those less familiar with technical analysis, this is significant. When the quarterly price trend of the S&P 500 ascends, but the RSI does not create a new high, it creates a divergence between the index price and its RSI. This 'negative divergence' is seen as an indicator that the apparent strength of the trend may be misleading.
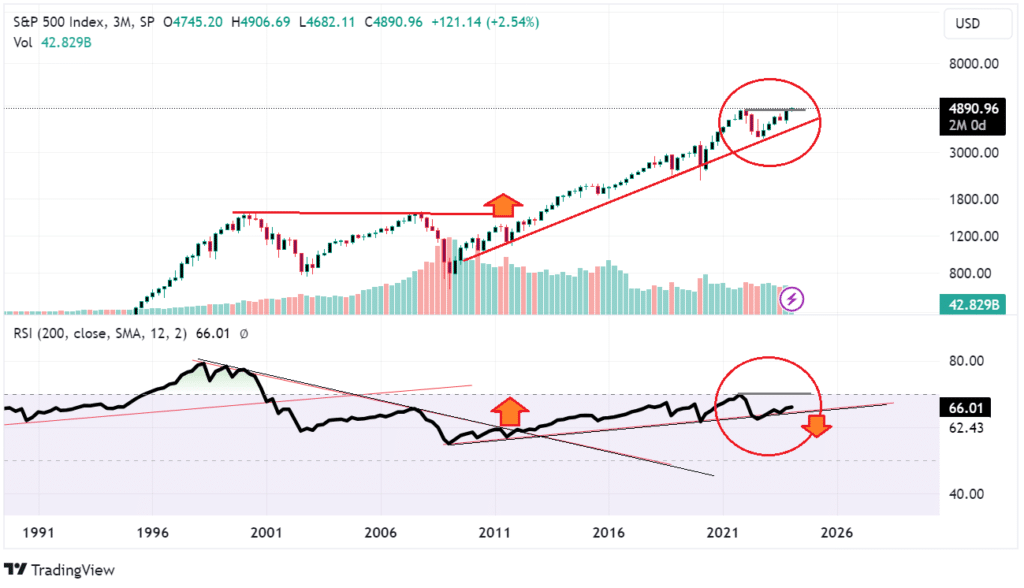
In the last six quarters, we've witnessed a striking divergence in the S&P 500. While the market has trended upwards, this ascent has not been mirrored in the 200-Quarter RSI (refer to the graph above, where the black chart at the bottom represents the RSI). This disconnect between market performance and RSI trends is critical. Similarly, a pattern emerges in Apple's sales growth trajectory.
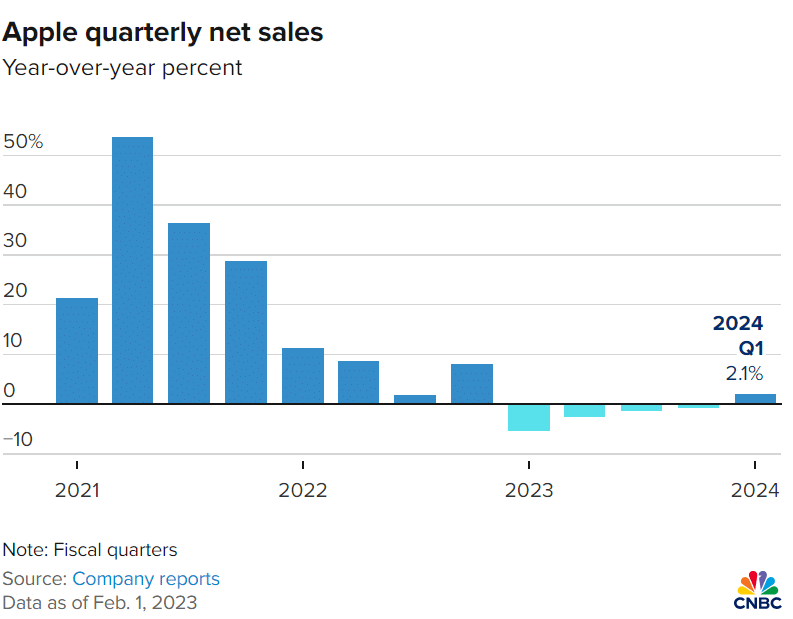
This persistent stagnation in Apple's sales over the past six months may be signaling a broader trend of economic slowing, mirroring the trend observed in the S&P 500's 200-Quarter Relative Strength Index. This scenario prompts a crucial question: If the recent uplift in market sentiment has not translated into significant gains in Apple's sales or the S&P 500's Quarterly RSI, what might the future hold when faced with potential risks ranging from ongoing global conflicts to a critical US election?
There's a strong likelihood that we could witness a decline in sales growth. Such a trend would not only impact Apple but could also be a harbinger of the challenges that many technology companies might face in 2024.
Apple's Long-Term Trends: Deciphering Potential Shifts in 2024.
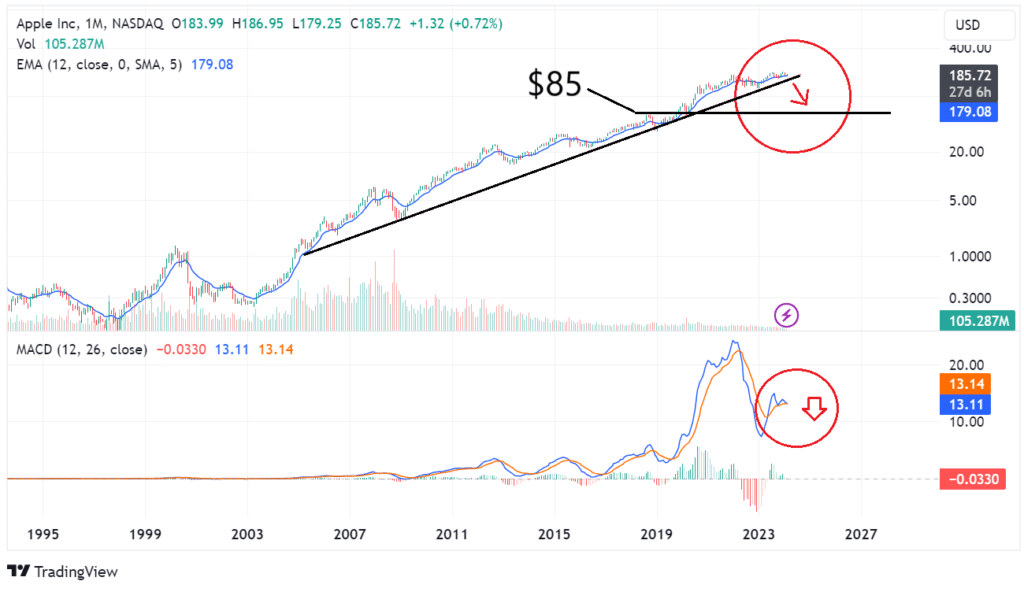
A closer look at Apple's performance over the last 30 years, particularly through a monthly MACD (Moving Average Convergence Divergence) indicator on the provided chart, reveals telling signs. The MACD, an oscillator chart located at the bottom of the price chart, is showing a negative trend on a monthly basis. This could be an early indicator that Apple may be entering a negative trend post-Q1 2024. If Apple's stock price begins to break away from its long-standing 14-year upward trajectory, it could signify a major shift not only for the company but for the broader tech market, particularly the Nasdaq.
This potential trend in Apple's stock is a critical topic that warrants further exploration, especially in relation to its impact on the Nasdaq. We will delve deeper into this analysis and its implications for the tech market in an upcoming article.
Conclusion
Apple's recent earnings report, while initially positive, underscores deeper concerns about the tech sector's future amidst global economic challenges. As the company navigates through these uncertainties, its performance will be a key indicator of the broader market's health and investor sentiment in the tech industry.
CONTACT US
The Scholarch LLC
1111B Governors Ave. STE 7059 Dover, DE 19904
research@thescholarch.com
Disclaimer: The Scholarch Research upholds the highest standards of integrity and transparency in all its publications. We unequivocally assert that the content within our research articles is authentic and genuine, steadfastly adhering to the principles of impartiality and objectivity. Our commentary and analysis are conducted disinterestedly, devoid of any personal or financial interests that might potentially skew our evaluations. It is our policy not to invest in the stock ideas we report on. Should an exception arise, it will be clearly disclosed at the conclusion of our reports or articles. The insights and assessments provided in our research articles and reports are the culmination of meticulous research, intended solely for informational and educational purposes. They are not promotional in nature and should not be interpreted as an endorsement or solicitation to buy or sell any stocks, financial products, or services. The content provided on our website or in our reports does not constitute investment advice or an endorsement of any specific investment strategy. While we endeavor to provide accurate and up-to-date information, The Scholarch LLC and its affiliates do not guarantee its completeness or accuracy. We shall not be held accountable for any losses incurred from reliance on this information. Past performance is not a reliable indicator of future results. Readers are strongly advised to conduct their own due diligence and consult with a professional advisor before making any investment decisions. The Scholarch LLC does not possess a financial advisory license and therefore does not offer personalized financial advice. This website and our reports may include links to third-party websites and information; The Scholarch LLC is not liable for their content or accuracy. We appreciate your trust in The Scholarch Reports. Thank you for reading our disclaimer.